- Solutions
- For Industry
- By Need
- Products
- VarbaseEnterprise CMS Distribution for Drupal
- Uber PublisherEnterprise Digital Media Platform Builder
- VardocDrupal Knowledge Base Platform
- Campaign StudioOpen Marketing Platform - by Acquia
- Open SocialSocial Business Platform - by Open Social
- Services
- Strategy
- Design
- Development
- Migration
- Support and MaintenanceSupport and Maintenance
- DevOps
- Digital Marketing

Datasheet

- Clients
- Ideas
- About
- Contact Us

How to Display Charts Using Entity Field
Have you used the Charts drupal module before? If yes, you should notice that it depends on showing data and statistics retrieved from a Views display which means gathering shared data and fields from multiple entities with some filters, i.e. how many nodes created on a monthly basis, how many users registered per day.
However, in some cases, you might need to show statistics about the entity itself (node, user, paragraph), in such a case the data would be in the node for example itself and its display should be managed from the node manage display, which is currently not supported in a direct way by the Charts module.
Actually, we met lately requirements to show product statistics as a field in a node using such a way gives the website editors the ability to control the data and the chart type to display without any technical background or site-building experience.
Consequently, there was a need to develop a new module called Charts Field Formatter to achieve the aforementioned requirements. In the rest of this post, we'll describe how to install the module and apply the needed configuration to show the chart without any custom code.
1. Install Charts Field Formatter and its dependencies
Install and enable Charts Field Fomatter module and its dependencies. It depends mainly on two modules:
- Charts module and specifically its Highcharts sub-module which are responsible for the chart rendering.
- TableField module which will facilitate editing the chart data or importing it as Comma Separated Values (CSV) file.
2. Add new field
Add a new field of type Table Field in the entity that you want to display the chart in it

3. Choose 'Charts' in the field format
Go to the entity display mode (i.e. /admin/structure/types/manage/page/display for Basic page content type) and choose Charts as field format.

4. Add new content
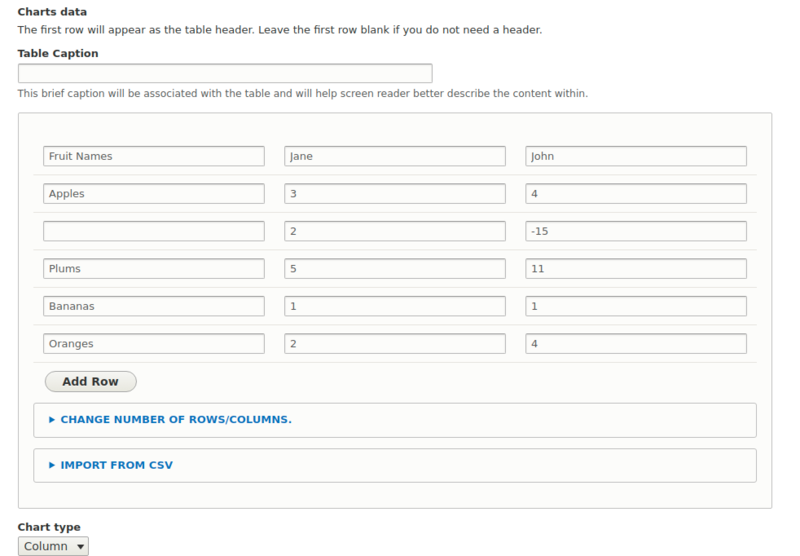
Add new content of the entity that has the 'Table Field' field to add its data manually or by importing it as CSV file. A sample CSV file can be found here.

5. Configure the Charts module default settings
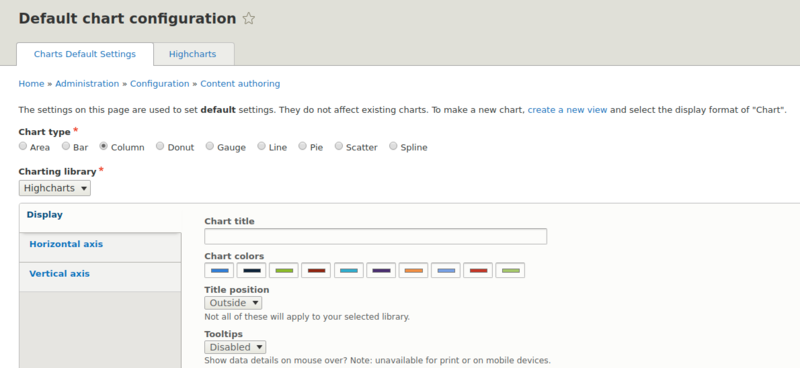
Go to /admin/config/content/charts in order to change the charts default configuration such as chart type (i.e. Column, Line, Pie, etc.) and color.

6. Optionally Add 'Chart Type' field
In case there was a need to give the site editor the option to change the chart type per entity instance, you can add field of type list (text) with machine name field_chart_type, otherwise, the chart type will be fetched from the charts default settings that is displayed in the previous screenshot. The field options should be as follows:

7. The Result...
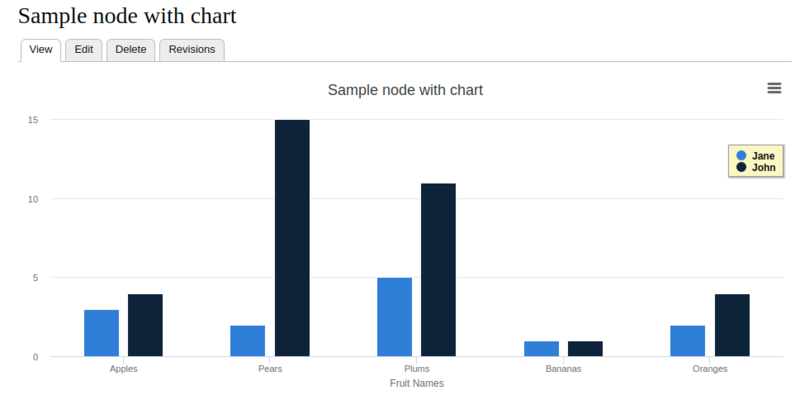
The final result of your entity and chart should be similar to this one, you can manage its display in your entity as you need:

Note:
The Charts Field Formatter module is tested with the Highcharts sub-module and library, therefore, make sure to install Highcharts library to your drupal libraries as described here. However, it should work with other charts types like Google Charts.


