- Solutions
- For Industry
- By Need
- Products
- VarbaseEnterprise CMS Distribution for Drupal
- Uber PublisherEnterprise Digital Media Platform Builder
- VardocDrupal Knowledge Base Platform
- Campaign StudioOpen Marketing Platform - by Acquia
- Open SocialSocial Business Platform - by Open Social
- Services
- Strategy
- Design
- Development
- Migration
- Support and MaintenanceSupport and Maintenance
- DevOps
- Digital Marketing

Datasheet

- Clients
- Ideas
- About
- Contact Us

A Guide to the Drupal Charts Field Formatter

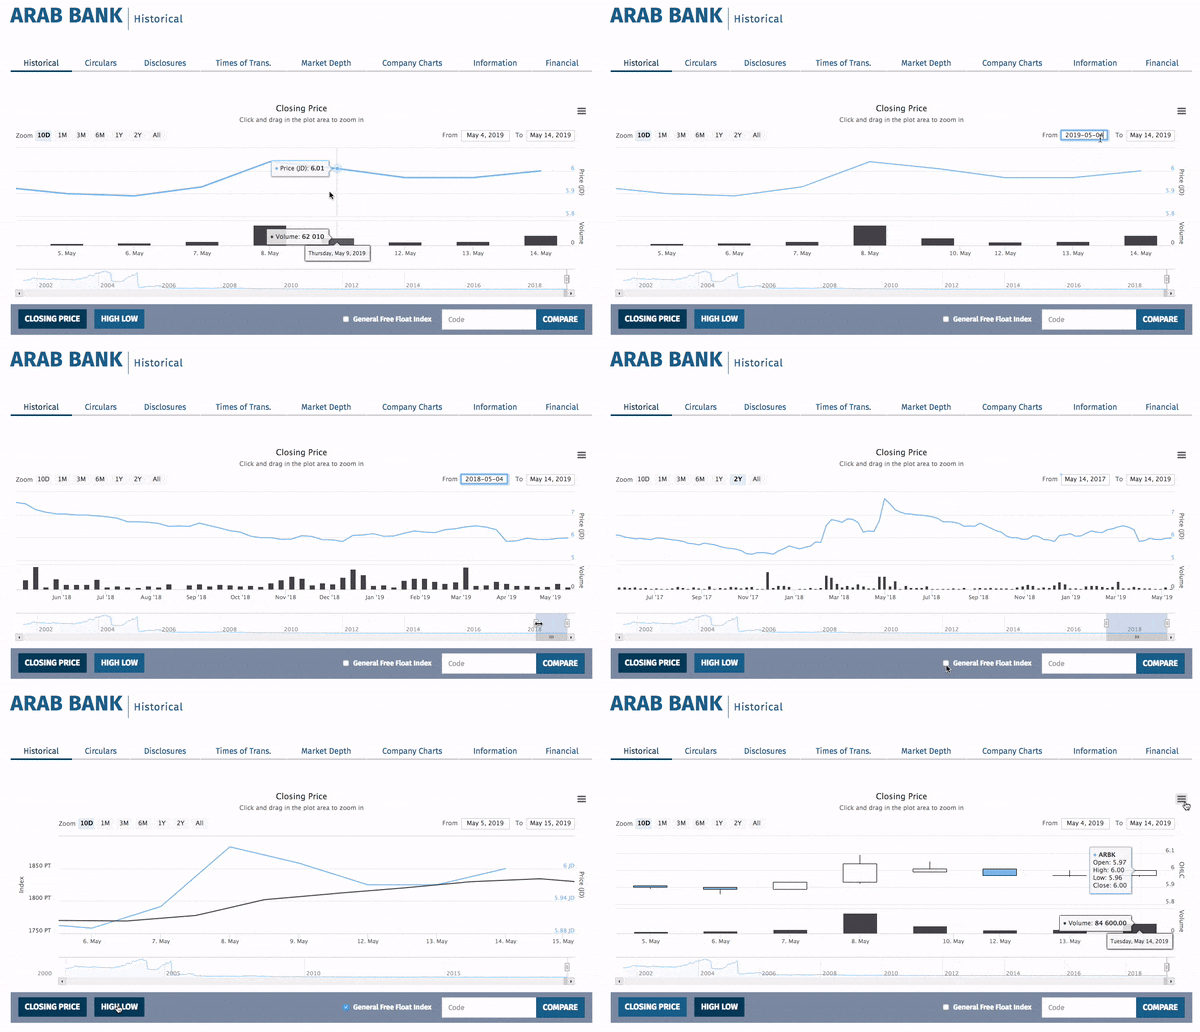
Many businesses (particularly operating in the financial sector) rely on displaying data analysis on their websites. The nature of this raw data prior to final display is shared amongst different sources, fields and is gathered from multiple entities with the option of filtering certain criteria.
The best solution to build such websites on Drupal os the Charts module which enables the display of charted data and statistics retrieved from a Views display.
But what if you needed to display stats or data about the entity itself? The node, the user, or the paragraph?
Typically the data you need would be within the node itself and displaying this data can and should be managed from the node manage display. However, this option is not directly supported by the Charts module at the current time.
We developed a new module called Charts Field Formatter. This module will enable website editors to manipulate and display any data using any preferred chart type as well.
If you are a website editor that knows your business would benefit from this new module, follow this user-friendly guide that allows you to display any chart data without much need for technical expertise:
1. Install Charts Field Formatter and Its Dependencies
Install and enable Charts Field Formatter module and its dependencies. It depends mainly on two modules:
- Charts module; specifically its Highcharts sub-module, both of which are responsible for the rendering of the chart.
- TableField module; which will facilitate editing the chart data or importing it as Comma Separated Values (CSV) file.
2. Add A New Field
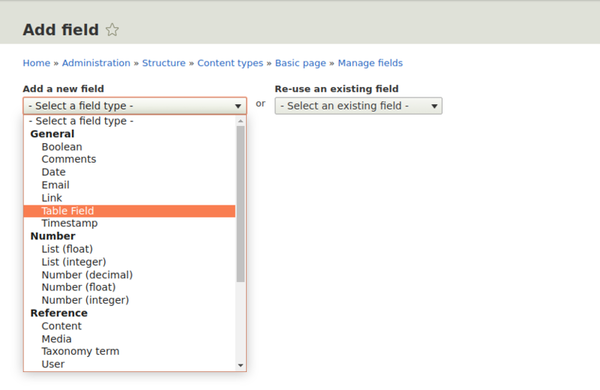
Add a new field of type: “Table Field” in the entity that you want to display the chart in.
3. Choose 'Charts' in the Field Format
Go to the entity display mode (i.e. /admin/structure/types/manage/page/display for Basic page content type) and choose “Charts” as a field format.

4. Add New Content
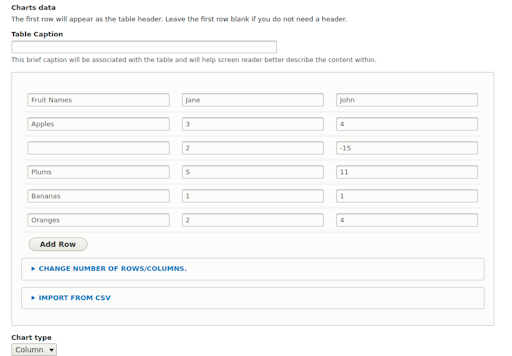
Add new content to the entity that has the “Table Field” field to add its data; either manually or by importing it as CSV file. A sample CSV file can be found here.
5. Configure the Charts module default settings
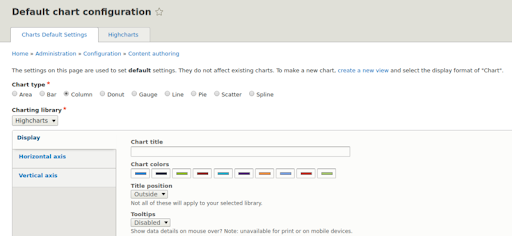
Go to /admin/config/content/charts in order to change the charts default configuration such as chart type (i.e. Column, Line, Pie, etc.) and color.
6. Optionally Add 'Chart Type' field
In case there was a need to give the site editor the option to change the chart type per entity instance, you can add field of type list “text” with machine name field_chart_type, otherwise, the chart type will be fetched from the charts default settings that is displayed in the previous screenshot. The field options should be as follows:

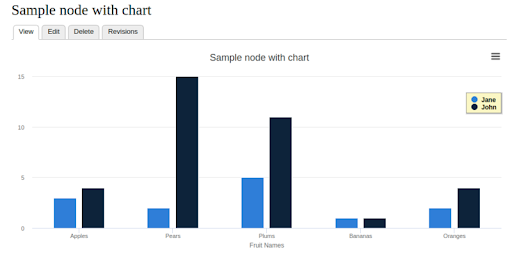
7. The Result...
The final result of your entity and chart should be similar to this one, you can manage its display in your entity as you need:
Note:
The Charts Field Formatter module is tested with the Highcharts sub-module and library, therefore, make sure to install Highcharts library to your drupal libraries as described here. However, it should work with other charts types like Google Charts.
- Drupal
- Drupal 9
- Drupal 8
- Charts Module
- Charts
- Data Analysis
- Data Display
- Financial Sector

