- Solutions
- For Industry
- By Need
- Products
- VarbaseEnterprise CMS Distribution for Drupal
- Uber PublisherEnterprise Digital Media Platform Builder
- VardocDrupal Knowledge Base Platform
- Campaign StudioOpen Marketing Platform - by Acquia
- Open SocialSocial Business Platform - by Open Social
- Services
- Strategy
- Design
- Development
- Migration
- Support and MaintenanceSupport and Maintenance
- DevOps
- Digital Marketing

Datasheet

- Clients
- Ideas
- About
- Contact Us

Enhancing a Drupal Site for Core Web Vitals

Nowadays, as a web developer, one of the most important metrics you need to pay attention to is how quickly your website loads. Your website loading speed has a massive effect on how successful you will be at attracting and retaining visitors. However, a significant problem web developers face is finding a tool that can give them detailed information in a simple and easy-to-understand manner. That is especially true for Drupal developers. Drupal is one of the more complicated CMS's in the industry, making it especially difficult for Web developers trying to optimize their website’s performance.
Why It’s Important to Optimize Your Website’s Performance
Your website’s performance is everything in today’s modern Internet paradigm. A poor-performing website will have low conversion rates and even worse SEO rankings. On top of that, it is almost impossible to do paid advertising on your website because most people will leave without waiting for your website to load. Amazon once realized that just a 100ms speed up was responsible for millions of dollars in increased revenue. In SEO, one of the biggest metrics is your website load time. Google has become a mobile-first search engine, making it even more important because most web users are on a data connection with a smaller screen. They don’t want to wait a few seconds for your website to load. It gets even more difficult if you have a content management system because you have to know your CMS on a deep level to optimize its performance. You must also understand the Core Web Vitals that Google has enunciated in its documentation. These metrics are critical to giving your website the quality signals used by Google and others to rate how well your website performs.
Do you need better website performance?
Get a free consultation now!
Core Web Vitals
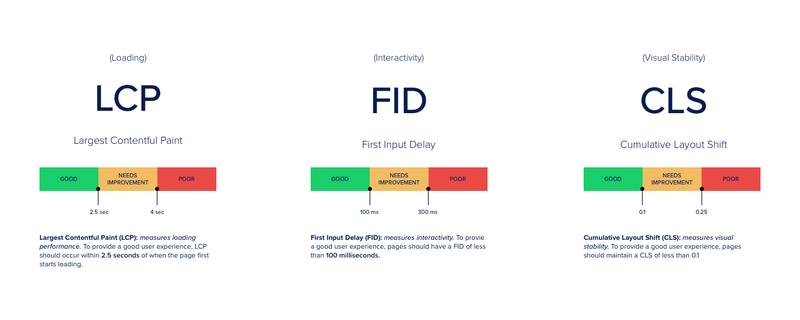
Google uses Core Web Vitals as a unified way to demonstrate quality on the web. If you do well with these quality signals, it means your website has an exceptional user experience that Google will want to promote to the top of its search engine rankings. There are three core vitals you need to look into for success. These Core Web Vital metrics are:

Largest Contentful Paint
The Largest Contentful Paint measures how fast it takes for the web browser to render the largest part of the webpage in the visible part of your web browser. A good website will have this metric be under 2.5 seconds. However, it is critical that you have it even lower to be in the top 1% of websites.
First Input Delay
As the name says, the first input delay measures how long it takes your website to become interactive. You have probably had a website that you tried to click on something, but nothing happened because the website was still loading. This interactivity is critical, and it needs to be under 100 ms.
Cumulative Layout Shift
One of the most frustrating things for users is having the website shift buttons while clicking. For example, you might have inadvertently clicked on a “buy now” button because the website shifted while you were about to click on something. This is what the cumulative layout shift metric measures, which should be less than 0.1.
The Google Lighthouse Tool
The good news is that Google maintains a Lighthouse tool to help you understand how to implement Core Web Vitals for your website. Another good news is the Vardot contribution to Lighthouse means that you will get excellent Drupal tips to improve Core Web Vitals. The tool requires that you import your URL and get started. It will scan your website and make recommendations based on the type of website you run.
Understanding Your Lighthouse Tool Results
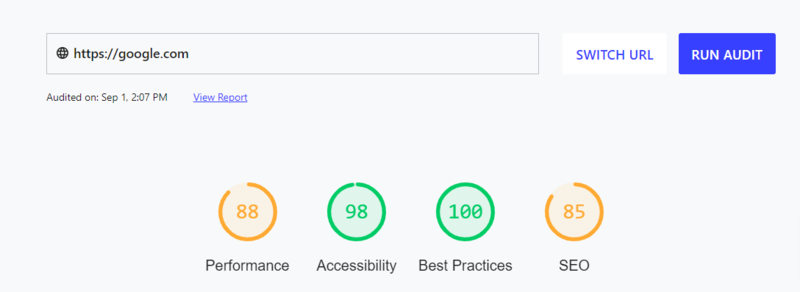
When you run the Lighthouse tool, it gives you a series of scores across four different categories. These categories are:

- Performance - The performance scores are calculated according to the major Core Web Vitals.
- Accessibility - Accessibility is determined by how well certain elements on your webpage lineup. For example, you might have a problem where the background and foreground colors do not have a sufficient contrast ratio.
- Best Practices - This tells you how well your website design aligns with known industry best practices.
- SEO - Search engine optimization focuses on how crawlable and indexable your webpage is. It also focuses on your links and whether your webpage offers things like meta descriptions and alt tags for images.
The Vardot Lighthouse Stack Pack for Drupal Websites

If you have a Drupal website, the good news is that the Vardot contribution to Lighthouse includes 15 things to consider to optimize your website. These 15 items are:
1. Reduce unused CSS
|
|
Consider removing unused CSS rules and only attach the needed Drupal libraries to the relevant page or component in a page. See the Drupal documentation link for details. To identify attached libraries that are adding extraneous CSS, try running code coverage in Chrome DevTools. You can identify the theme/module responsible from the URL of the stylesheet when CSS aggregation is disabled in your Drupal site. Look out for themes/modules that have many stylesheets in the list which have a lot of red in code coverage. A theme/module should only enqueue a stylesheet if it is actually used on the page. |
2. Reduce unused JavaScript
|
|
Consider removing unused JavaScript assets and only attach the needed Drupal libraries to the relevant page or component in a page. See the Drupal documentation link for details. To identify attached libraries that are adding extraneous JavaScript, try running code coverage in Chrome DevTools. You can identify the theme/module responsible from the URL of the script when JavaScript aggregation is disabled in your Drupal site. Look out for themes/modules that have many scripts in the list which have a lot of red in code coverage. A theme/module should only enqueue a script if it is actually used on the page. |
3. Serve images in next-gen formats
|
|
Consider configuring WebP image formats with a Convert image style on your site. |
4. Defer offscreen images
|
|
Install a Drupal module that can lazy load images. Such modules provide the ability to defer any offscreen images to improve performance. |
5. Properly size images
|
|
Ensure that you are using the native Responsive Image Styles provided from Drupal (available in Drupal 8 and above). Use the Responsive Image Styles when rendering image fields through view modes, views, or images uploaded through the WYSIWYG editor. |
6. Eliminate render-blocking resources
|
|
Consider using a module to inline critical CSS and JavaScript, or potentially load assets asynchronously via JavaScript such as the Advanced CSS/JS Aggregation module. Beware that optimizations provided by this module may break your site, so you will likely need to make code changes. |
7. Minify CSS
|
|
Ensure you have enabled "Aggregate CSS files" in the "Administration » Configuration » Development" page. You can also configure more advanced aggregation options through additional modules to speed up your site by concatenating, minifying, and compressing your CSS styles. |
8. Minify JavaScript
|
|
Ensure you have enabled "Aggregate JavaScript files" in the "Administration » Configuration » Development" page. You can also configure more advanced aggregation options through additional modules to speed up your site by concatenating, minifying, and compressing your JavaScript assets. |
9. Use video formats for animated content
|
|
Consider uploading your GIF to a service which will make it available to embed as an HTML5 video. |
10. Serve static assets with an efficient cache policy
|
|
Set the "Browser and proxy cache maximum age" in the "Administration » Configuration » Development" page. Read about Drupal cache and optimizing for performance. |
11. Avoids enormous network payloads
|
|
Consider using Responsive Image Styles to reduce the size of images loaded on your page. If you are using Views to show multiple content items on a page, consider implementing pagination to limit the number of content items shown on a given page. |
12. Efficiently encode images
|
|
Consider using a module that automatically optimizes and reduces the size of images uploaded through the site while retaining quality. Also, ensure you are using the native Responsive Image Styles provided from Drupal (available in Drupal 8 and above) for all images rendered on the site. |
13. Reduce initial server response time
|
|
Themes, modules, and server specifications all contribute to server response time. Consider finding a more optimized theme, carefully selecting an optimization module, and/or upgrading your server. Your hosting servers should make use of PHP opcode caching, memory-caching to reduce database query times such as Redis or Memcached, as well as optimized application logic to prepare pages faster. |
14. Preconnect to required origins
|
|
Preconnect or dns-prefetch resource hints can be added by installing and configuring a module that provides facilities for user agent resource hints. |
15. Ensure text remains visible during webfont load
|
|
Specify `@font-display` when defining custom fonts in your theme. |
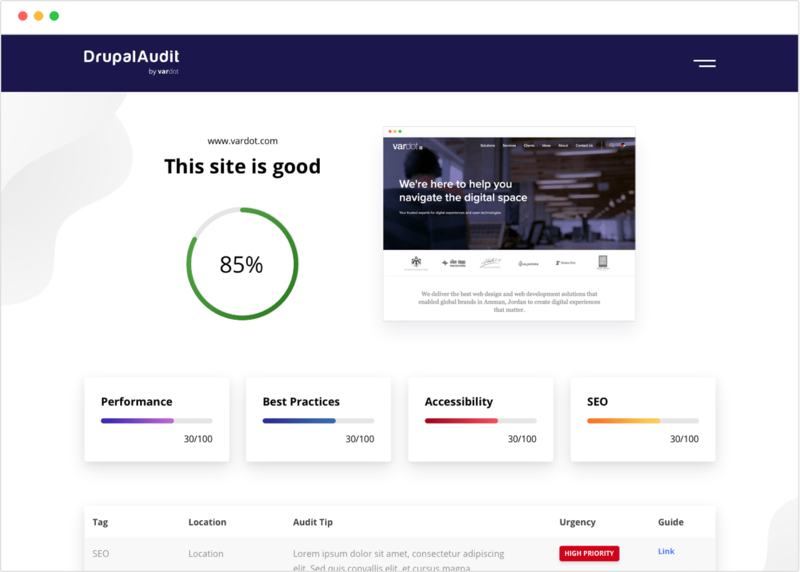
All of this functionality is built into the Drupal Audit tool from Vardot. It is part of the Drupal Stack pack for Lighthouse and includes Drupal tips to improve Core Web Vitals. It is completely free to use, and you can start optimizing your Drupal websites today.
The Complete Drupal SEO Guide for 2022
Outline the best practices you need to implement to ensure your website is optimized for search engines!


