"We needed to ensure that the new digital platform will be rebuilt according to the best standards and practices out there. The ASE’s importance to the Jordanian economy cannot be overstated and as such we can only rely upon Drupal 8 as a platform, and Vardot as its experts." - Adel Abu Assaf (CTO of Amman Stock Exchange)

Immediately at launch in Jan. 2019; the revamped Amman Stock Exchange website witnessed a surge in traffic from organic mobile and tablet search in comparison with the same period last year.
Featured Highlights:
- 61% increase in Organic Mobile Search and by 9% via tablet devices.
- Bounce rates reduced by 20% on desktop, 15% on tablet and 3% on mobile.
- 99% decrease in error rate.
- New visitors increased by 18%.
- Seamless automated feeds of market data from 12 sources.

Seamless Migration
The old ASE website hosted a massive amount of content in the form of financial records for publicly listed companies, as well as user accounts for various stakeholders who used to login to the website.
Careful measures were taken when we upgraded the website to ensure that the legacy data and user accounts were migrated safely.
Moreover, we enhanced the data structure in the new website.
Digital Asset Management
A website as important as the ASE cannot afford to have performance issues. One way of ensuring that performance quality remains consistently high is by upgrading their Digital Asset Management (DAM) process and tools.
ASE editors used to upload digital assets each time they needed them resulting in duplicate files that weigh on the CMS.
With their upgraded Drupal 8 media library, ASE’s editors can now:
- Upload each file once without repeating the process all over again.
- Index or categorize their digital assets to make them search-friendly; saving precious time for the editors.
- Reuse all digital assets whenever needed without choking the CMS with duplicate data.
- Edit images with certain design features such as cropping.
- Drag and drop digital files for a more efficient editing experience.
Empowered User
In the new website; every user will have access to a new account dashboard.
All users will be able to easily create and manage their portfolio/accounts from this customizable dashboard that is meant to boost user convenience. Users can personalize their notifications, display only relevant content and have quicker access based on their preferences.
The new website even allows users to manage and customize market data ticker.
Intelligent UX Design
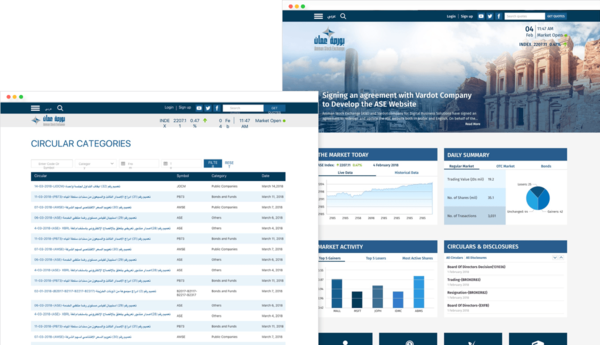
Supported by user research and behavior analysis; our UX/UI specialists delivered an intelligent design that focuses on boosting functionality and user convenience.
The new user experience is customizable thanks to Varbase and enables the ASE to deliver a seamless multilingual website to all the relevant target audiences. Translations can be easily implemented and updated from the website’s admin interface.
Data Integrations
The new ASE website aggregates data from multiple sources and displays the information on the front-end seamlessly.
This data consists of:
- Real-time feed of market information (i.e.) stock prices, ask & bid orders and etc.
- Historical information (i.e.) corporate details, closing prices, bulletins and etc.
To guarantee that no delays occur while importing real-time data; feeds are updated via binary protocols. Historical data, on the other hand, is updated in a timely manner whilst providing triggers for other integrated systems to ensure data consistency.
Moreover; we gave the ASE admins the ability to manually override the previous data by uploading files directly to a parsed data directory.
Upgraded Performance
Due to the strategic and important role that the ASE website plays in the daily routine of traders and investors operating within the Jordanian market, we were tasked to identify technologies that optimize the website’s performance and ensure that downtime is minimized.
As such, the infrastructure was designed for high availability and redundancy using technologies such as MySQL replication, Memcache to handle the internal Drupal cache and Varnish as a reverse proxy.
Enhanced Data Visualization
Realizing the importance of a dynamic UX and data visualization to the end-users (traders and investors who browse mainly via mobile), we utilized best-in-class interactive data visualization solutions from the Highcharts library.
The ASE now has highly customizable charts with sophisticated navigation, annotation, analytics, and over 40 built-in technical indicators.
Here are a few highlighted examples of charts enabled in the new ASE site:
Market Index Chart
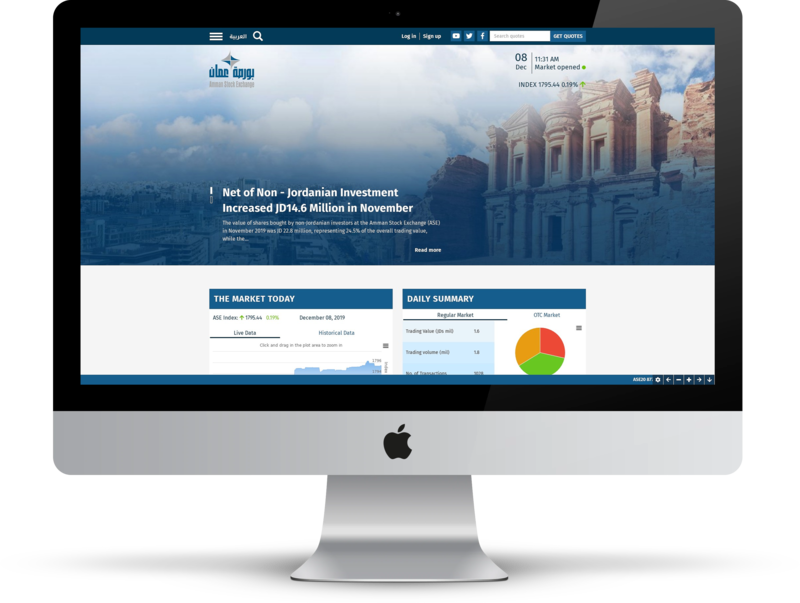
The market index chart displays both real-time and historical data with the ability to customize views based on timelines. Users will also be able to zoom into the chart to identify particular indices. Also; the chart can be downloadable in various formats such as reports and presentations by the users.
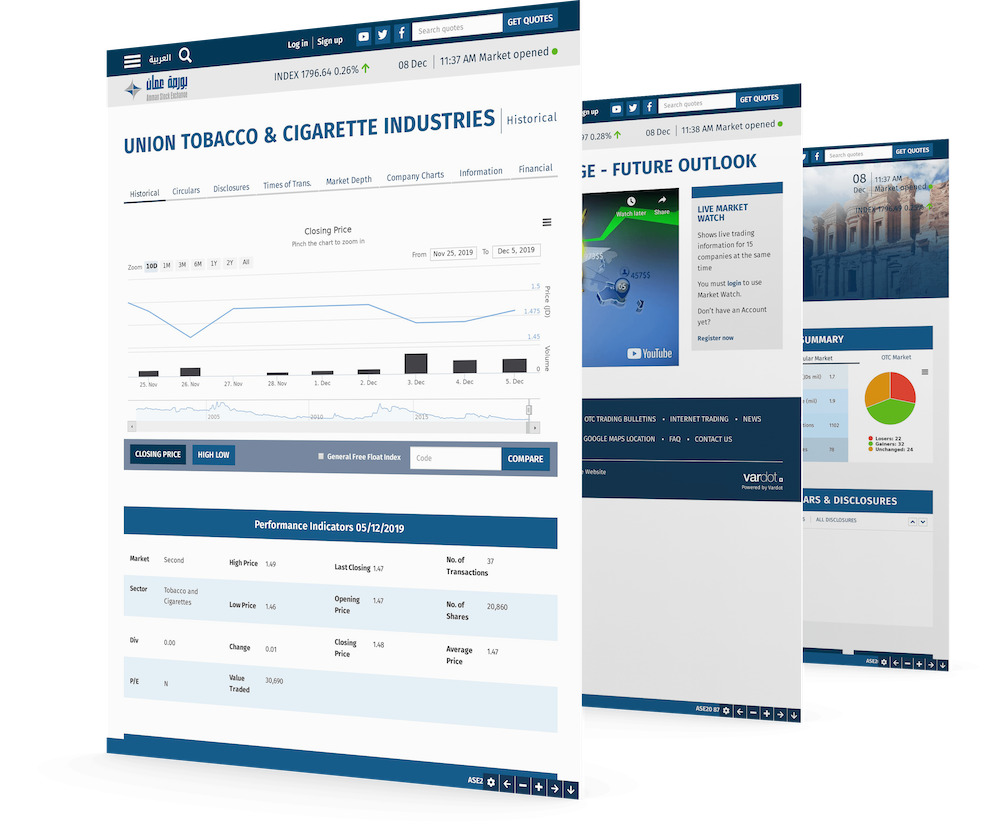
Company’s Historical Performance Chart
Users rely upon historical performance trends and patterns when it comes to trading and investing in a particular listed company’s stock. This chart can be easily manipulated by the user to display the relevant data needed.
Personalization criteria include the date, timeline, prices, trade volume, ability to compare with other stocks & the general index to name but a few.
For more technical insight into the project visit the case study on Drupal.org here.


